NR 15-01
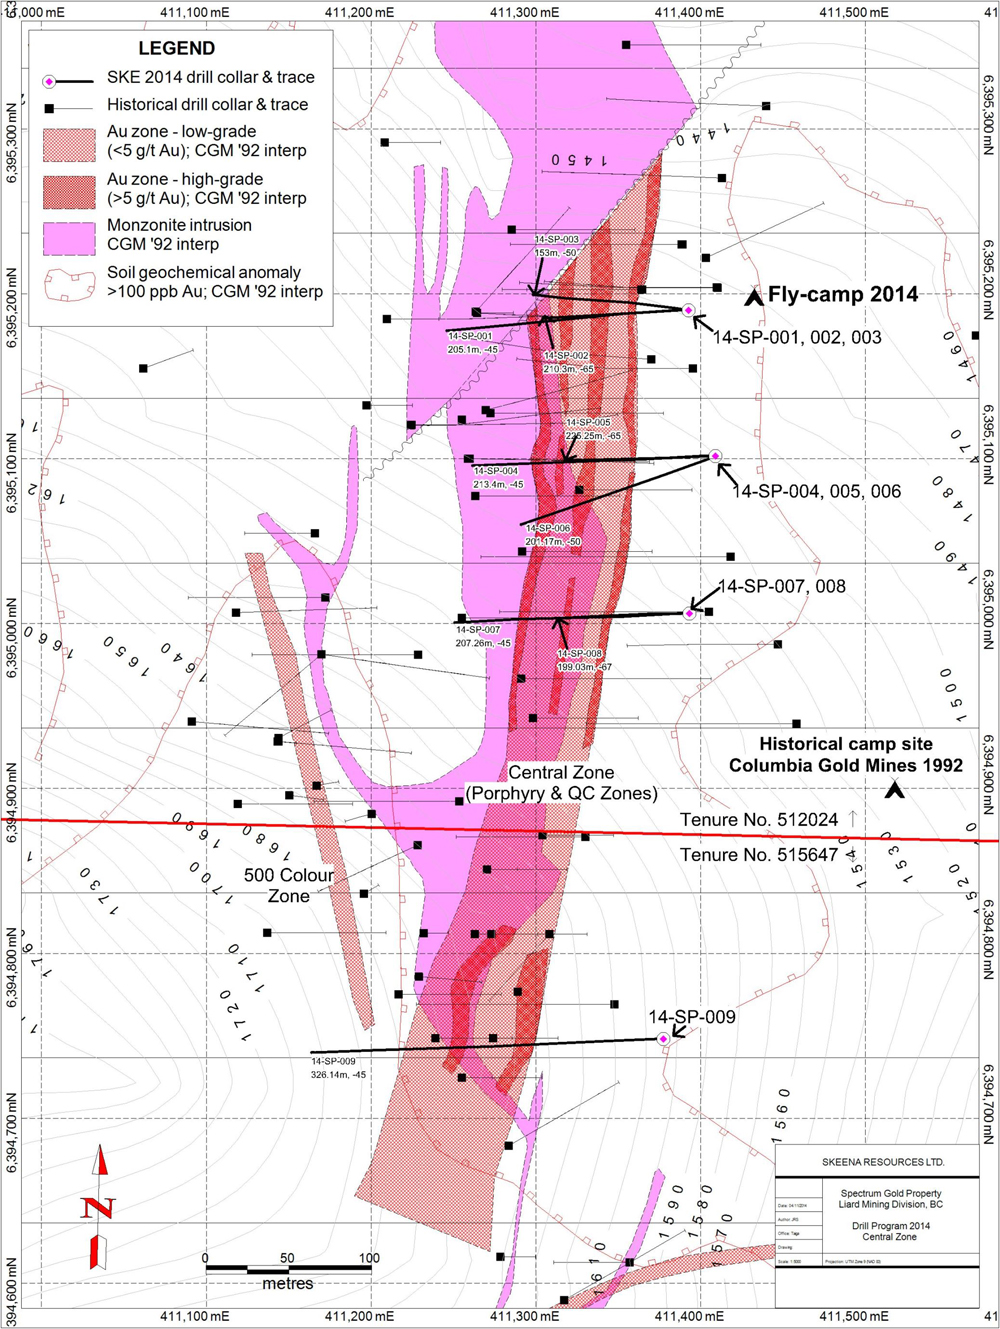
Skeena Resources Limited (TSX.V: SKE) (“Skeena” or the “Company”) is pleased to report assay results for the last four holes drilled on its 100% owned Spectrum property in northwest British Columbia. The property is situated 40 km west of Imperial Metals’ Red-Chris Mine and 14 km west of Teck’s GJ deposit. All holes yielded intervals of significant gold values. Highlights include: 43.80 g/t Au over 2.0 metres in hole 14-SP-006; 9.50 g/t Au over 2.0 metres in hole 14-SP-007; 4.58 g/t Au over 9.0 metres in hole 14-SP-008; 13.70 g/t Au over 4.0 metres and 254.50 g/t over 2.0 metres in hole 14-SP-09. This last intercept represents the deepest intersection of significant mineralization obtained to date (from 285 to 287 metres) from an apparent down-plunge extension of the 500 Colour Zone. All of the other intercepts were from an average of 50 metres beneath historic intercepts in the Central Zone.
A comprehensive listing of significant intervals is present as Table 1. The location of all the drill holes is presented in the plan map below. Interpretation of the drill results is on-going and will be a critical item for the planning of the 2015 exploration program. During the most recent program, 250 intervals of on-site historic core were re-sampled. The detailed results are presented in Table 2. Re-sampling of the historic drill core was impacted by more than 20 years of open field storage. There are issues with the amount of material available for re-sampling and the reliability of sample depth markers. Slight variation in sample intervals and inadequate remaining material may explain some differences in results. The sampling crew also observed that many high-grade intervals had already been sampled to exhaustion.
Preliminary observations indicate that the previously interpreted presence of a structurally controlled high-grade gold system in the Central Zone appears to have been confirmed. Furthermore, this system remains open both on strike and to depth. A review of the re-sampling of historic core and a statistical analyses of the assays of duplicate samples, inserted standards, and inserted blanks (the quality assurance/quality control, or QA/QC procedures) indicates that a moderate nugget effect exists which needs to be further investigated. In general the re-sampling compared reasonably well with the original assays, though higher-grade intervals (> 5 g/t Au) display greater variability (i.e. nugget effect) than low grade intervals (< 2 g/t Au). However, there are enough differences, both positive and negative, to warrant further re-sampling as well as some caution in the future design and application of QA/QC procedures and drill spacing.
The Central Zone drilling indicates a gold-rich system with no important secondary metals. However, historical results confirm that other targets on the property contain both significant gold and copper values. The 2015 exploration program will continue expanding both 500 Colour Zone and the Central Zone while other targets will be up-graded to the drill stage as the Company begins to prioritize all of the known targets.
Table 1
| Hole Number (ID) |
From (m) |
To (m) |
Interval (m) |
Au (g/t) |
|---|---|---|---|---|
| 14-SP-006 | 123.0 | 125.2 | 2.2 | 2.83 |
| 139.0 | 141.0 | 2.0 | 1.19 | |
| 177.0 | 179.0 | 2.0 | 1.04 | |
| 195.0 | 197.0 | 2.0 | 43.80* | |
| 14-SP-007 | 22.0 | 24.0 | 2.0 | 2.31 |
| 36.0 | 38.0 | 2.0 | 1.40 | |
| 54.0 | 56.0 | 2.0 | 1.04 | |
| 58.0 | 62.0 | 4.0 | 1.49 | |
| 88.0 | 90.0 | 2.0 | 1.49 | |
| 103.0 | 105.0 | 2.0 | 3.22 | |
| 103.0 | 140.0 | 37.0 | 3.78 | |
| 113.0 | 117.0 | 4.0 | 5.26 | |
| Including | 113.0 | 115.0 | 2.0 | 9.50* |
| 136.0 | 140.0 | 4.0 | 1.44 | |
| 158.0 | 160.0 | 2.0 | 1.65 | |
| 195.0 | 198.0 | 3.0 | 3.82 | |
| Including | 196.0 | 197.0 | 1.0 | 7.60* |
| 14-SP-008 | 11.0 | 13.0 | 2.0 | 1.18 |
| 17.0 | 19.0 | 2.0 | 1.24 | |
| 65.0 | 69.0 | 4.0 | 1.40 | |
| 119.0 | 123.0 | 4.0 | 2.32 | |
| Including | 119.0 | 121.0 | 2.0 | 3.30 |
| 155.0 | 157.0 | 2.0 | 1.53 | |
| 159.0 | 161.0 | 2.0 | 2.22 | |
| 173.0 | 190.0 | 17.0 | 3.41 | |
| Including | 175.0 | 184.0 | 9.0 | 4.58 |
| Including | 175.0 | 177.0 | 2.0 | 8.50* |
| And | 182.0 | 184.0 | 2.0 | 8.42 |
| And | 186.0 | 190.0 | 4.0 | 3.05 |
| 14-SP-009 | 151.0 | 153.0 | 2.0 | 1.68 |
| 157.0 | 159.0 | 2.0 | 1.07 | |
| 173.0 | 177.0 | 4.0 | 13.67 | |
| Including | 173.0 | 175.0 | 2.0 | 5.24 |
| And | 175.0 | 177.0 | 2.0 | 22.10* |
| 181.0 | 183.0 | 2.0 | 1.79 | |
| 255.0 | 257.0 | 2.0 | 10.00* | |
| 259.0 | 260.0 | 1.0 | 11.10* | |
| 285.0 | 287.0 | 2.0 | 254.50* | |
| 295.0 | 301.0 | 6.0 | 3.12 | |
| Note: asterisk (*) indicates Au Fire Assay; all other assays ICP-MS | ||||
Table 2
| Historical Composites | Skeena Resampling Results | ||||||||
|---|---|---|---|---|---|---|---|---|---|
| Hole Number (ID) |
From (m) |
To (m) |
Interval (m) |
Au (g/t) |
Hole Number (ID) |
From (m) |
To (m) |
Interval (m) |
Au (g/t) |
| 90-59 | 76.0 | 78.5 | 2.5 | 5.55 | 90-59 | 76.0 | 78.5 | 2.5 | 7.15 |
| 100.6 | 126.2 | 25.6 | 6.53 | 100.6 | 126.2 | 25.6 | 9.76 | ||
| including | 100.6 | 103.3 | 2.7 | 19.79 | including | 100.6 | 103.3 | 2.7 | 63.20 |
| and | 110.0 | 115.8 | 5.8 | 10.48 | and | 110.0 | 115.8 | 5.8 | 8.06 |
| 90-63 | 30.5 | 84.1 | 53.6 | 3.43 | 90-63 | 30.5 | 84.1 | 53.6 | 1.61 |
| including | 69.3 | 78.5 | 9.2 | 22.41 | including | 69.3 | 78.5 | 9.2 | 6.62 |
| including | 69.3 | 75.5 | 6.2 | 24.34 | including | 69.3 | 75.5 | 6.2 | 9.62 |
| including | 69.3 | 73.6 | 4.3 | 34.29 | including | 69.3 | 73.6 | 4.3 | 13.63 |
| 96.0 | 100.0 | 4.0 | 4.75 | 96.0 | 100.0 | 4.0 | 7.96 | ||
| 129.0 | 130.5 | 1.5 | 6.47 | 127.0 | 139.9 | 12.9 | 2.74 | ||
| including | 133.5 | 135.3 | 1.8 | 9.50 | |||||
| 91-69 | 86.7 | 100.0 | 13.3 | 4.07 | 91-69 | 86.7 | 100.0 | 13.3 | 0.51 |
| including | 86.7 | 89.5 | 2.8 | 16.61 | 86.7 | 89.5 | 2.8 | 0.15 | |
| 86.7 | 88.0 | 1.3 | 39.42 | 86.7 | 88.0 | 1.3 | 0.15 | ||
| 102.8 | 108.0 | 5.2 | 3.77 | 102.8 | 108.0 | 5.2 | 2.36 | ||
| including | 105.0 | 108.0 | 3.0 | 4.65 | 105.0 | 108.0 | 3.0 | 2.38 | |
| 91-70 | 86.5 | 87.0 | 0.5 | 9.49 | 91-70 | interval missing, not sampled by SKE | |||
| 120.5 | 122.0 | 1.5 | 2.79 | 120.5 | 122.0 | 1.5 | 0.22 | ||
| 181.5 | 183.5 | 2.0 | 4.91 | interval missing, not sampled by SKE | |||||
| 91-73 | 78.0 | 97.0 | 19.0 | 2.07 | 91-73 | 78.0 | 97.0 | 19.0 | 2.52 |
| including | 86.0 | 89.0 | 3.0 | 5.84 | including | 86.0 | 89.0 | 3.0 | 7.17 |
| 145.4 | 153.1 | 7.7 | 4.11 | 145.4 | 153.1 | 7.7 | 4.27 | ||
| 177.9 | 179.5 | 1.6 | 4.48 | 177.9 | 179.5 | 1.6 | 0.1 | ||
| 91-76 | 18.9 | 71.0 | 52.1 | 5.44 | 91-76 | 18.9 | 71.0 | 52.1 | 7.29 |
| including | 38.0 | 43.5 | 5.5 | 19.94 | including | 38.0 | 43.5 | 5.5 | 32.67 |
| and | 63.0 | 65.5 | 2.5 | 10.63 | and | 63.0 | 65.5 | 2.5 | 11.03 |
| and | 70.4 | 71.0 | 0.6 | 26.40 | interval missing, not sampled by SKE | ||||
| 91-77 | 15.3 | 41.0 | 25.7 | 3.42 | 91-77 | 15.3 | 41.0 | 25.7 | 3.00 |
| including | 15.3 | 26.5 | 11.2 | 5.83 | including | 15.3 | 26.5 | 11.2 | 5.41 |
| including | 15.3 | 18.5 | 3.2 | 16.84 | including | 15.3 | 18.5 | 3.2 | 13.72 |
| and | 38.0 | 40.0 | 2.0 | 6.19 | and | 38.0 | 40.0 | 2.0 | 2.73 |
| 109.0 | 114.0 | 5.0 | 1.93 | 109.0 | 114.0 | 5.0 | 2.56 | ||
| 91-85 | 36.3 | 39.5 | 3.20 | 2.75 | 91-85 | 36.3 | 40.5 | 4.20 | 1.11 |
| including | 36.3 | 37.2 | 0.9 | 7.75 | including | 36.3 | 37.2 | 0.9 | 1.36 |
| 78.0 | 86.0 | 8.0 | 4.11 | 78.0 | 86.0 | 8.0 | 0.95 | ||
| including | 83.0 | 85.0 | 2.0 | 12.09 | 78.0 | 80.0 | 2.0 | 1.07 | |
| 99.0 | 101.0 | 2.0 | 4.94 | 99.0 | 101.0 | 2.0 | 2.46 | ||
| 106.3 | 108.0 | 1.7 | 6.37 | 106.3 | 108.0 | 1.7 | 4.55 | ||
| 91-86 | 72.0 | 115.0 | 43.0 | 7.20 | 91-86 | 72.0 | 115.0 | 43.0 | 6.07 |
| including | 72.0 | 83.8 | 11.8 | 16.8 | including | 72.0 | 83.8 | 11.8 | 13.81 |
| including | 75.0 | 81.0 | 6.0 | 31.76 | including | 75.0 | 81.0 | 6.0 | 24.45 |
| and | 101.0 | 106.4 | 5.4 | 13.37 | and | 101.0 | 106.4 | 5.4 | 12.02 |
| and | 110.0 | 112.0 | 2.0 | 6.48 | and | 110.0 | 112.0 | 2.0 | 2.04 |
Quality Assurance/Quality Control
Drilling was conducted under the supervision of Jacques Stacey, M.Sc., P.Geol. and Doug Cruickshank, M.Sc., P.Geol, both of Taiga Consultants Ltd.. A rigorous chain-of-custody and QA/QC program, consisting of the insertion of certified standard control samples, duplicates and blanks, was applied to the NQ diameter, split half-core samples. Sample preparation was handled by an Acme Analytical Laboratories facility in Smithers, B.C., and the analyses conducted by Acme Analytical in Vancouver, B.C. Gold content was determined by Inductively-Coupled Plasma Mass Spectrometer of a 15 gram aliquot utilizing hot aqua regia digestion. All samples that assayed greater than or equal to 5 g/t were re-analyzed by fire assay with a gravimetric finish of a 30 grams aliquot.
The Qualified Person for the Company, as defined in National Instrument 43-101, is Rupert Allan, P. Geol., Vice-President Exploration.
ON BEHALF OF THE BOARD OF DIRECTORS OF
SKEENA RESOURCES LIMITED
Walt Coles Jr., President & CEO
CAUTIONARY STATEMENT REGARDING FORWARD-LOOKING INFORMATION
Except for statements of historical fact relating to Skeena Resources Limited, certain information contained herein constitutes “forward-looking statements”. Forward-looking statements include statements that are predictive in nature, depend upon or refer to future events or conditions, or include words such as “expects”, “anticipates”, “plans”, “believes”, “considers”, “intends”, “targets”, or negative versions thereof and other similar expressions, or future or conditional verbs such as “may”, “will”, “should”, “would” and “could”. We provide forward-looking statements for the purpose of conveying information about our current expectations and plans relating to the future and readers are cautioned that such statements may not be appropriate for other purposes. By its nature, this information is subject to inherent risks and uncertainties that may be general or specific and which give rise to the possibility that expectations, forecasts, predictions, projections or conclusions will not prove to be accurate, that assumptions may not be correct and that objectives, strategic goals and priorities will not be achieved. These risks and uncertainties include but are not limited to those identified and reported in Skeena Resources Limited’s public filings, which may be accessed at www.sedar.com. Other than as specifically required by law, we undertake no obligation to update any forward-looking statement to reflect events or circumstances after the date on which such statement is made, or to reflect the occurrence of unanticipated events, whether as a result of new information, future events, results or otherwise.
Neither TSX Venture Exchange nor the Investment Industry Regulatory Organization of Canada accepts responsibility for the adequacy or accuracy of this release